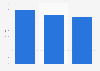
| Characteristic | Share of respondents |
|---|---|
| Wanted better performance | 32% |
| An existing product had broken | 28% |
| Wanted specific new features | 26% |
| Existing product was not working well | 23% |
| Wanted a more up to date version | 23% |
| Wanted better looking version | 18% |
| Wanted smaller/lighter product | 11% |
| New product allowed for new gadgets | 10% |
| Needed additional product | 9% |
| Bought as a gift | 9% |
| Bought for work | 7% |
| Simply as a treat | 7% |
| Saw someone else owning it | 6% |
| Triggered by major event in personal life | 6% |
| Was prompted by email received | 5% |
| None of the above | 5% |
| Wanted product enjoyable with family | 4% |
| Going on holiday | 3% |
| Saw a celebrity owning it | 3% |
| Other | 3% |
| Was prompted by advert online | 2% |
| Due to moving home | 0% |
| Don't know | 0% |
The chart is not accessible to screen readers. Please switch to the table view to access the data.
Loading statistic...
Download
Source
Sources
Release date
July 2014
More information
Region
Italy
Survey time period
April 14 to 28, 2014
Number of respondents
350 respondents
Age group
18-64 years
Special properties
all adults who had purchased mentioned device in the last three months
Method of interview
Online panel
Supplementary notes
* This question was phrased by the source as follows: "When you or other members of your household purchased these products or devices, what were the reasons for purchase?"
Citation formats