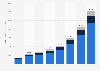
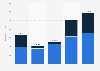
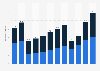
| Characteristic | Travel budget in 1,000 U.S. dollars |
|---|---|
| - | - |
| - | - |
| - | - |
| - | - |
| - | - |
| - | - |
| - | - |
| - | - |
| - | - |
| - | - |
| - | - |
| - | - |
| - | - |
| - | - |
| - | - |
| - | - |
| - | - |
| - | - |
| - | - |
| - | - |
| - | - |
| - | - |
| - | - |
| - | - |
| - | - |
The chart is not accessible to screen readers. Please switch to the table view to access the data.
Download
Source
Sources
Release date
December 2015
More information
Region
Worldwide
Survey time period
October 14 to 29, 2015
Number of respondents
10,756 (total survey respondents)
Age group
18 years and older
Method of interview
Online survey
Supplementary notes
Values are based on respondents from each country who gave an actual value for their 2016 budget.
Figures have been rounded.
Country base: Australia: 343, Switzerland: 100, United States: 749, United Kingdom: 533, New Zealand: 187, Canada: 305, Austria: 129, Germany: 266, France: 1,056, Argentina: 280, Ireland: 72, Japan: 175, Spain: 580, Mexico: 242, Italy: 1,569, China: 71, Brazil: 404, India: 337, Portugal: 139, Turkey: 176, Russia: 249, South Africa: 293, Greece: 421, Thailand: 217
Citation formats