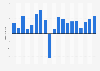
| Characteristic | Percent change in number of jobs |
|---|---|
| - | - |
| - | - |
| - | - |
| - | - |
| - | - |
| - | - |
| - | - |
| - | - |
| - | - |
| - | - |
The chart is not accessible to screen readers. Please switch to the table view to access the data.
Download
Source
Sources
Release date
January 2015
More information
Region
United Kingdom
Survey time period
2004 to 2013
Supplementary notes
*Cities detailed are the ten with the highest rates of increase.
Note from the source: "due to breaks in the data series these statistics have been calculated by adding together the differences in jobs between 2004/2005, 2006/2008 and 2008/2013, and dividing by jobs in 2004."
Citation formats