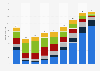
| Characteristic | Share of respondents |
|---|---|
| - | - |
| - | - |
| - | - |
| - | - |
The chart is not accessible to screen readers. Please switch to the table view to access the data.
Download
Source
Sources
Release date
January 2015
More information
Region
United States
Survey time period
28 to 30 May, 2014
Number of respondents
1,115 respondents
Age group
18 years and older
Special properties
forecast
Method of interview
Online survey
Supplementary notes
* A TV enabled with Netflix, Amazon Prime, Hulu Plus, etc.
The question posed by the source: "Which of the following types of sources do you plan to watch most of your TV/movies/sports content through in 6 years' time (the year 2020), if any?"
The source does not provide any information regarding missing percentage points to 100 percent.
Citation formats