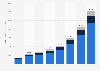
| Characteristic | 2019 | 2020 |
|---|---|---|
| Bucket list trip | 24% | 23% |
| Family or multi-gen trip | 8% | 12% |
| Solo vacation | 7% | 12% |
| Summer vacation | 10% | 10% |
| Celebration vacation | 8% | 9% |
| Romantic getaway | 10% | 9% |
| Holiday travel | 3% | 4% |
| Family reunion | 5% | 4% |
| Girls getaway | 3% | 3% |
| Weekend getaway | 2% | 2% |
| Wedding, graduation, or other event | 4% | 2% |
| Spring break trip | 2% | 1% |
| Required travel | 2% | 1% |
| Guys getaways | 1% | 1% |
| Other | 11% | 8% |
The chart is not accessible to screen readers. Please switch to the table view to access the data.
Loading statistic...
Download
Source
Source
Release date
January 2020
More information
Region
United States
Survey time period
September 16 to 26, 2019
Number of respondents
780 respondents
Age group
50 years and older
Special properties
respondents indicated up to five trips
Method of interview
Online survey
Supplementary notes
Question was phrased by source as 'For the international trips you plan on taking next year, please read the list of trip types below and select your primary motivation for each trip.'
Citation formats