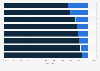
| Characteristic | Better | About the same | Worse |
|---|---|---|---|
| Lending/Investment standards | 7% | 38% | 15% |
| Keeping information and money safe | 8% | 38% | 18% |
| Know-how of own industry workings | 14% | 37% | 17% |
| Moral standards | 14% | 32% | 12% |
| Cost of capital | 16% | 36% | 11% |
| Generating social returns on investment | 16% | 34% | 10% |
| Generating financial returns on investments | 17% | 41% | 7% |
| Accessibility | 21% | 36% | 10% |
| Speed | 23% | 33% | 10% |
| Flexibility | 26% | 33% | 9% |
| Willingness to take risks | 29% | 29% | 10% |
The chart is not accessible to screen readers. Please switch to the table view to access the data.
November 2014
United Kingdom
March to September 2014
primary industry figures as well as extensive surveys of businesses and consumers
The percentages do not add up to 100% because the question was asked only to SMEs with previous experience dealing with alternative finance providers.
The methodology is clarified by the source as follows: "Four stages of research activity were carried out from March to September 2014. (1) Stage one involved collecting primary transactional data directly from alternative finance platforms. (2) Stage two consisted of designing and distributing model-specific questionnaires to survey funders and fundraisers of alternative finance. In total 15,658 users were surveyed. (3) Stage three conducted in association with ACCA and PwC included two external national surveys to understand the level of awareness among consumers of alternative finance. 2,007 consumers and 506 SMEs were surveyed. (4) Stage four was the industry-wide tracking survey among UK crowdfunding associations and P2P associations to gather industrial figures for year 2014. Transactional data was collected for quarters one to three of 2014."