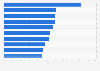
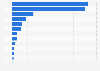
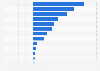
| Characteristic | 2014 | 2015 | 2016 |
|---|---|---|---|
| - | - | - | - |
| - | - | - | - |
| - | - | - | - |
| - | - | - | - |
| - | - | - | - |
| - | - | - | - |
| - | - | - | - |
| - | - | - | - |
| - | - | - | - |
| - | - | - | - |
| - | - | - | - |
| - | - | - | - |
| - | - | - | - |
| - | - | - | - |
| - | - | - | - |
| - | - | - | - |
| - | - | - | - |
| - | - | - | - |
The chart is not accessible to screen readers. Please switch to the table view to access the data.
Download
Source
Source
Release date
September 2017
More information
Region
United Kingdom
Survey time period
2014 to 2016
Number of respondents
74 respondents
Special properties
IMA member firms
Supplementary notes
The source adds the following information: "This survey captures asset management undertaken by members of the investment association on behalf of domestic and overseas clients. It is based on the results of questionnaire responses from 74 IA member firms, who between the manage 5.9 trillion GBP in this country (84% of total UK assets under management by the entire IA membership base)."
Citation formats