
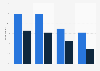
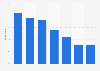
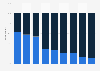

| Characteristic | 2018 | 2019 | 2020 |
|---|---|---|---|
| - | - | - | - |
| - | - | - | - |
| - | - | - | - |
| - | - | - | - |
| - | - | - | - |
| - | - | - | - |
| - | - | - | - |
| - | - | - | - |
| - | - | - | - |
| - | - | - | - |
| - | - | - | - |
| - | - | - | - |
| - | - | - | - |
| - | - | - | - |
The chart is not accessible to screen readers. Please switch to the table view to access the data.
Download
Source
Source
Release date
June 2020
More information
Region
Brazil, Canada, China, Germany, Hong Kong, Ireland, Israel, Mexico, Singapore, South Africa, Switzerland, United Arab Emirates, United Kingdom, United States
Survey time period
February 6. to March 3. 2020
Number of respondents
1,488 respondents
Special properties
global blockchain-savvy senior executives
Method of interview
Online survey
Supplementary notes
*The original survey question was phrased as "What are your organization or project's barriers, if any, to increasing adoption and scale in blockchain technology? (Percentage of respondents who feel the issue is a barrier)
Percentages equal more than 100 percent because respondents were allowed to submit more than one answer.
Citation formats



