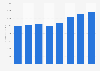
| Characteristic | Sales in billion U.S. dollars |
|---|---|
| - | - |
| - | - |
| - | - |
| - | - |
| - | - |
| - | - |
| - | - |
| - | - |
| - | - |
| - | - |
| - | - |
| - | - |
| - | - |
| - | - |
| - | - |
| - | - |
| - | - |
| - | - |
| - | - |
| - | - |
| - | - |
| - | - |
| - | - |
| - | - |
| - | - |
| - | - |
| - | - |
| - | - |
| - | - |
| - | - |
| - | - |
| - | - |
| - | - |
| - | - |
| - | - |
| - | - |
| - | - |
| - | - |
| - | - |
| - | - |
| - | - |
The chart is not accessible to screen readers. Please switch to the table view to access the data.
United States
1965 to 2025
Note that figures differ depending upon the source and differing definitions as to what constitutes "OTCs." The 1995 sales figure represents a change in the way Nielsen defined an OTC drug and thus shows a greater increase than for other years. The number is more representative of the true OTC drug market as defined by the Food and Drug Administration. The statistic does not include vitamins/minerals/nutritional supplements. Data does not include online sales (1992-2023).
* Excludes Wal-Mart.
** Due to methodology changes, including reporting from Wal-Mart and expanded coverage in club, dollar, and convenience channels, sales figures for 2009 represent a more complete picture of the OTC marketplace versus previous years. 2009 through 2013 totals include U.S. - all outlets (food, drug, mass, select club and dollar store retailers, convenience, and military stores. A few categories include a combination of OTC medicines as well as health-related products which are not classified as drugs by FDA.
*** Due to methodology changes in 2014, sales figures for 2011-2014 have been updated. These figures no longer include several categories included in 2010 and prior, which caused the figures to decrease.