| Characteristic | Percentage-point turnaround |
|---|---|
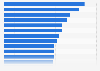
| Fifth Third Bancorp | 1,426.4% |
| Genworth Financial | 1,378.3% |
| XL Group | 1,069.1% |
| Discover Financial Services | 983.2% |
| Lincoln National | 924.8% |
| American International Group | 844% |
| SLM | 828.9% |
| Principal Financial Group | 825.1% |
| Hartford Financial Services Group | 824.5% |
| Capital One Financial | 786.4% |
The chart is not accessible to screen readers. Please switch to the table view to access the data.
Loading statistic...
Download
Source
Source
Release date
September 2013
More information
Region
United States
Survey time period
October 9, 2007 to September 10, 2013
Supplementary notes
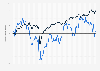
Bloomberg ranked U.S. financial companies on the percentage-point difference between their stock returns from October 9, 2007 to March 9, 2009, which were the high and low points of the S&P 500 prior to and during the financial-crisis period, and from March 9, 2009 to September 10, 2013, which was the recovery period. Included were companies with market capitalization of at least 10 billion U.S. dollars on October 9, 2007 and available stock prices. Real estate companies and Real Estate Investment Trusts were excluded. Prices reflect stock splits.
Citation formats