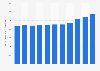
| Characteristic | GVA in billion GBP |
|---|---|
| - | - |
| - | - |
| - | - |
| - | - |
| - | - |
| - | - |
| - | - |
| - | - |
| - | - |
The chart is not accessible to screen readers. Please switch to the table view to access the data.
February 2020
United Kingdom
2010 to 2018
* The creative industries include:
- Advertising and marketing
- Architecture
- Crafts
- Design: product, graphic and fashion
- Film, TV, video, radio and photography
- IT, software and computer services
- Publishing
- Museums, galleries and libraries
- Music, performing and visual arts
2017 GVA is based on the output measure of GVA to allow consistency with the sector measures for 2017. This is aligned to average GVA
up to and including 2016 (last Supply Use balanced year) but then uses growth in the output measure as a proxy for GVA beyond that. The
2017 GVA figure will be revised next year, once the Supply Use tables have been balanced.
Figures have been rounded.