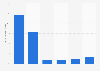
| Characteristic | Q4 '15 | Q1 '16 | Q2 '16 |
|---|---|---|---|
| Netflix | 48.1% | 51.9% | 53.7% |
| Amazon Prime Instant Video | 19.6% | 23.1% | 24% |
| Hulu/Hulu Plus | 10.6% | 12% | 11.8% |
| HBO Now | 4.1% | 5.5% | 5.6% |
| Shomi | - | - | 3.7% |
| YouTube Red | - | - | 3% |
| CBS All Access | 1.8% | 1.8% | 1.7% |
| Playstation Vue | 1.8% | 1.4% | 1.4% |
| Blockbuster | 1.8% | 1.4% | 0.7% |
| Sling TV | 1.6% | 1.5% | 1.5% |
| Other | 2% | 2.9% | 2.3% |
| None | 44.6% | 39.3% | 36.1% |
The chart is not accessible to screen readers. Please switch to the table view to access the data.
Loading statistic...
Download
Source
Sources
Release date
August 2016
More information
Region
North America
Survey time period
Q4 2015 to Q2 2016
Number of respondents
3,100 respondents
Supplementary notes
Multiple answers were possible. The source does not provide data regarding the age of participants or the type of survey used.
Figures for periods other than Q1 and Q2 2016 come from previous reporting.
Penetration rates for Shomi and YouTube Red were not previously measured
Citation formats