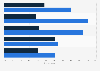
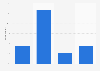
| Characteristic | Very satisfied | Somewhat satisfied | Somewhat dissatisfied | Very dissatisfied | No opinion |
|---|---|---|---|---|---|
| Jan 7-10, 2013 | 22% | 45% | 16% | 13% | 4% |
| Jan 5-8, 2012 | 23% | 49% | 14% | 10% | 5% |
| Jan 4-6, 2008 | 14% | 44% | 20% | 17% | 4% |
| Jan 15-18, 2007 | 13% | 40% | 26% | 18% | 3% |
| Jan 9-12, 2006 | 16% | 42% | 23% | 16% | 3% |
| Jan 3-5, 2005 | 14% | 44% | 22% | 17% | 3% |
| Jan 12-15, 2004 | 19% | 51% | 16% | 13% | 1% |
| Jan 13-16, 2003 | 11% | 43% | 26% | 17% | 3% |
| Jan 7-9, 2002 | 10% | 41% | 27% | 20% | 2% |
The chart is not accessible to screen readers. Please switch to the table view to access the data.
Loading statistic...
Download
Source
Source
Release date
April 2013
More information
Region
United States
Survey time period
2002 to 2013
Age group
18 years and older
Method of interview
Telephone interview
Supplementary notes
The source poses the question as follows: "Next, we'd like to know how you feel about the state of the nation in each of the following areas. For each one, please say whether you are -- yery satisfied, somewhat satisfied, somewhat dissatisfied, or very dissatisfied. How about the nation's security from terrorism?"
The source does not specify the number of respondents for each year.
The source does not provide accurate information about the age of respondents.
The source does not provide results for 2009 to 2011.
Citation formats