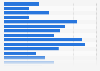
| Hospital (Location) | Revenue in billion U.S. dollars |
|---|---|
| University of Pittsburgh Medical Center Presbyterian | 12.21 |
| The Cleveland Clinic | 11.63 |
| Cedars-Sinai Medical Center (Los Angeles) | 10.59 |
| Florida Hospital Orlando | 10.17 |
| Stanford (Calif.) Hospital | 9.41 |
| New York-Presbyterian Hospital/Weill Cornell Medical Center (New York City) | 8.91 |
| Yale-New Haven (Conn.) Hospital | 8.15 |
| Hospital of the University of Pennsylvania (Philadelphia) | 7.97 |
| Montefiore Medical Center- Moses Division Hospital (Bronx, N.Y.) | 7.68 |
| University of California San Francisco Medical Center at Parnassus | 7.67 |
The chart is not accessible to screen readers. Please switch to the table view to access the data.
Loading statistic...
Download
Source
Source
Release date
June 2014
More information
Region
United States
Survey time period
2013
Supplementary notes
According to CMS cost report data analyzed by American Hospital Directory. Data are for short term acute-care hospitals, critical access hospitals and children's hospitals. The hospital total patient revenues reported here are reported to CMS by the hospitals in their most recent cost reports and, in some cases, may include patient revenue from other facilities that share a provider number with the main hospital.
Citation formats