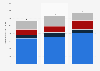
| Characteristic | Cost per inpatient stay in U.S. dollars |
|---|---|
| - | - |
| - | - |
| - | - |
| - | - |
| - | - |
| - | - |
| - | - |
| - | - |
| - | - |
| - | - |
| - | - |
| - | - |
| - | - |
| - | - |
| - | - |
| - | - |
| - | - |
| - | - |
| - | - |
| - | - |
| - | - |
| - | - |
| - | - |
| - | - |
The chart is not accessible to screen readers. Please switch to the table view to access the data.
December 2025
United States
2000 to 2023
Cost per stay (not adjusted for inflation)
The source provides the following information:
The NIS includes information on total hospital charges for an inpatient stay. Charges represent the amount a hospital billed for the entire hospital stay, excluding professional (physician) fees. Total hospital charges are converted to costs using HCUP Cost-to-Charge Ratios (CCRs) based on hospital accounting reports from the Centers for Medicare & Medicaid Services (CMS). Costs reflect the actual expenses incurred in the production of hospital services, such as wages, supplies, and utility costs. For each hospital in the NIS, a hospital-wide cost-to-charge ratio is used. The average cost per stay is calculated using discharges with nonmissing total costs. Costs are not imputed if total charges are not reported on the discharge record. Costs are only reported from 2000 forward because HCUP Cost-to-Charge Ratios are unavailable prior to 2000.聽