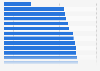
| Characteristic | Average rank across 13 metrics (index score)* |
|---|---|
| Utah | 7.5 |
| Minnesota | 10.5 |
| Colorado | 12.8 |
| Nebraska | 13.7 |
| North Dakota | 14.5 |
| Virginia | 16.8 |
| Hawaii | 17.5 |
| Iowa | 17.5 |
| South Dakota | 18.1 |
| Maryland | 18.5 |
The chart is not accessible to screen readers. Please switch to the table view to access the data.
August 2012
United States
January 2, 2011 to June 30, 2012
531,154 respondents
18 years and older
Telephone interview
* The findings are based on the following metrics measured as part of the Gallup Daily tracking, including the Gallup-Healthways Well-Being Index:
Full-time employment for an employer, economic confidence index, job creation index, supervisor relationship, standard of better living optimism, city optimism, daily learning, easy access to clean, safe water, easy access to a safe place to exercise, obesity, smoking, dentist visits, future life evaluation.
According to the source, The
selection of the 13 metrics was not based on any statistical model, but rather on their presumed relevance to future livability. Each metric contributed equally to the final ranking. Here, you can find more information about the methodology.