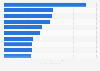
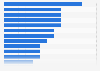
| Characteristic | Total direct compensation in million U.S. dollars |
|---|---|
| Liberty Global (Fries, Michael T.) | 112.2 |
| Microsoft (Nadella, Satya) | 84.3 |
| Oracle (Ellison, Lawrence J.) | 67.3 |
| Qualcomm (Mollenkopf, Steven) | 60.7 |
| CBS (Moonves, Leslie) | 57.2 |
| Disney (Walt) (Iger, Robert A.) | 46.5 |
| Viacom (Dauman, Philippe P.) | 44.3 |
| Prudential Financial (Strangfeld, John) | 37.5 |
| General Electric (Immelt, Jeffrey R.) | 37.3 |
| Actavis plc (Saunders, Brenton) | 36.6 |
| Lockheed Martin (Hewson, Marillyn) | 33.7 |
| ExxonMobil (Tillerson, Rex W.) | 33.1 |
| Comcast (Roberts, Brian L.) | 33 |
| Time Warner (Bewkes, Jeffrey L.) | 32.9 |
| Aramark (Foss, Eric) | 32.4 |
| Liberty Interactive (Maffei, Gregory) | 32.4 |
| CVSHealth (Merlo, Larry) | 32.4 |
| 21st Century Fox (Murdoch, K. Rupert) | 29.2 |
| Honeywell International (Cote, David M.) | 29.1 |
| Boeing (McNerney, W. James, Jr.) | 28.9 |
The chart is not accessible to screen readers. Please switch to the table view to access the data.
Loading statistic...
Download
Source
Sources
Release date
June 2015
More information
Region
United States
Survey time period
2014
Special properties
CEO pay from the biggest 300 U.S. public companies by revenue
Supplementary notes
Total direct compensation is a calculation of the salary, annual incentives and long-term incentives earned by a CEO.
Citation formats