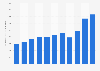
| Characteristic | Index value* |
|---|---|
| 2010 | 294 |
| 2009 | 272 |
| 2008 | 239 |
| 2007 | 237 |
| 2006 | 261 |
| 2005 | 237 |
| 2004 | 224 |
| 2003 | 223 |
| 2002 | 206 |
| 2001 | 183 |
| 2000 | 179 |
| 1999 | 172 |
| 1998 | 171 |
| 1997 | 168 |
| 1996 | 167 |
| 1995 | 170 |
| 1994 | 154 |
| 1993 | 157 |
| 1992 | 143 |
| 1991 | 132 |
| 1990 | 123 |
| 1989 | 118 |
| 1988 | 114 |
| 1987 | 113 |
| 1986 | 118 |
| 1985 | 115 |
| 1984 | 108 |
| 1983 | 112 |
| 1982 | 106 |
| 1981 | 109 |
| 1980 | 100 |
The chart is not accessible to screen readers. Please switch to the table view to access the data.
Loading statistic...
Download
Source
Source
Release date
February 2012
More information
Region
United States
Survey time period
1980 to 2010
Supplementary notes
* The Index of Dependence on Government measures how much federal social programs have grown. The index consists of five components: Housing assistance, health care and welfare programs, retirement programs, higher education assistance, and rural and agricultural services. These government programs are identified as contributing to dependence on government.
Citation formats