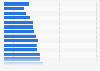
| Characteristic | Damage in million U.S. dollars |
|---|---|
| 2021 | 44,228 |
| 2020 | 38,537 |
| 2019 | 31,614 |
| 2018 | 46,972 |
| 2017 | 36,510 |
| 2016 | 23,789 |
| 2015 | 19,759 |
| 2014 | 21,801 |
| 2013 | 19,054 |
| 2012 | 23,977 |
| 2011 | 19,511 |
| 2010 | 20,486 |
| 2009 | 22,911 |
| 2008 | 24,734 |
| 2007 | 24,399 |
| 2006 | 20,340 |
| 2005 | 20,427 |
| 2004 | 17,344 |
| 2003 | 21,129 |
| 2002 | 17,586 |
| 2001* | 17,118 |
| 2000 | 13,457 |
| 1999 | 12,428 |
| 1998 | 11,510 |
| 1997 | 12,940 |
| 1996 | 12,544 |
| 1995 | 11,887 |
| 1994 | 12,778 |
| 1993 | 11,331 |
| 1992 | 13,588 |
| 1991 | 11,302 |
| 1990 | 9,495 |
The chart is not accessible to screen readers. Please switch to the table view to access the data.
Loading statistic...
Download
Source
Sources
Release date
October 2022
More information
Region
United States
Survey time period
1990 to 2021
Supplementary notes
* Does not include fire losses related to terrorism.
Includes allowance for uninsured and unreported losses but excludes losses to government property and forests. Represents incurred losses.
Data for previous years can be accessed .
The source does not indicate a release date. The date of access was taken as the release date.
Citation formats