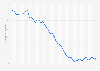
| Characteristic | Value of losses in billion U.S. dollars |
|---|---|
| 2024 | 2.16 |
| 2023 | 2 |
| 2022 | 1.9 |
| 2021 | 1.5 |
| 2020 | 1.6 |
| 2019 | 1.64 |
| 2018 | 1.4 |
| 2017 | 1.45 |
| 2016 | 0.9 |
| 2015 | 1.2 |
| 2014 | 1.1 |
| 2013 | 1.1 |
| 2012 | 1.3 |
| 2011 | 1 |
| 2010 | 1 |
| 2009 | 1 |
| 2008 | 1.2 |
| 2007 | 1.1 |
| 2006 | 1 |
| 2005 | 1 |
| 2004 | 1 |
| 2003 | 1.1 |
| 2002 | 1.2 |
| 2001* | 1.3 |
| 2000 | 1.2 |
| 1999 | 1.1 |
| 1998 | 1.1 |
| 1997 | 1.1 |
| 1996 | 1.1 |
| 1995 | 1 |
| 1994 | 1 |
| 1993 | 0.9 |
| 1992 | 0.8 |
| 1991 | 0.8 |
| 1990 | 0.8 |
| 1989 | 0.8 |
| 1988 | 0.8 |
| 1987 | 0.7 |
| 1986 | 0.7 |
| 1985 | 0.7 |
| 1984 | 0.6 |
| 1983 | 0.6 |
| 1982 | 0.5 |
| 1981 | 0.5 |
| 1980 | 0.5 |
The chart is not accessible to screen readers. Please switch to the table view to access the data.
Zoomable Statistic: Select the range in the chart you want to zoom in on.
Loading statistic...
Download
Source
Source
Release date
November 2025
More information
Region
United States
Survey time period
1980 to 2024
Special properties
current U.S. dollars.
Supplementary notes
Highway vehicles include any vehicle designed to operate normally on highways, such as automobiles, motorcycles, buses, trucks, and trailers, but not manufactured homes on foundations. Direct property damage figures do not include indirect losses, like business interruption.
Direct property damage figures do not include indirect losses, like business interruption.
Data prior to 2024 taken from previous editions.
Citation formats