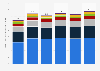
| Characteristic | Media rights revenue in billion U.S. dollars |
|---|---|
| - | - |
| - | - |
| - | - |
| - | - |
| - | - |
| - | - |
| - | - |
| - | - |
| - | - |
| - | - |
| - | - |
| - | - |
| - | - |
| - | - |
| - | - |
| - | - |
| - | - |
| - | - |
The chart is not accessible to screen readers. Please switch to the table view to access the data.
Download
Source
Source
Release date
November 2019
More information
Region
Canada, United States
Survey time period
2006 to 2019
Supplementary notes
* Fees paid to show sporting events on broadcast and cable television networks, television stations, terrestrial radio, satellite radio, the internet, and mobile devices.
** Forecast
Citation formats