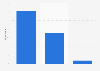
| Characteristic | Share of workers |
|---|---|
| Political professionals and clergy | 25% |
| Hospitality, catering, food industry | 18% |
| Building, public works | 18% |
| Services for individuals and communities | 18% |
| Studies and Research | 14% |
| Information Technology and Telecommunications | 14% |
| Craftsmanship | 13% |
| Transport, logistics, and tourism | 12% |
| Process industries | 11% |
| Communication, information, art and entertainment | 11% |
| Flexible materials, wood, graphic industries | 10% |
| Electricity, electronics | 10% |
| Mechanics, metalworking | 9% |
| Engineers and executives in the industry | 9% |
| Commerce | 9% |
| Maintenance | 9% |
| Management, business administration | 8% |
| Health, social, cultural, and sports action | 7% |
| Teaching, training | 7% |
| Banking and insurance | 6% |
| Agriculture, marine, fishing | 6% |
| Public administration, legal professions, military, and police | 5% |
The chart is not accessible to screen readers. Please switch to the table view to access the data.
Loading statistic...
Download
Source
Sources
Release date
November 2023
More information
Region
France
Survey time period
2019
Age group
15-64 years old
Special properties
Employed persons
Supplementary notes
Non-immigrants are those born in France or born French abroad.
Data from France excluding Mayotte.
Citation formats