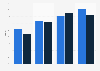
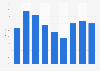
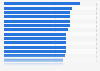
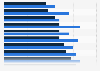
| Characteristic | Less than 1,285 U.S. dollars | From 1,285 to 1,840 U.S. dollars | From 1,840 to 2,755 euros | Greater than 2,755 U.S. dollars | Together |
|---|---|---|---|---|---|
| 1999 | 47% | 56% | 67% | 84% | 63% |
| 2000 | 39% | 52% | 69% | 80% | 59% |
| 2001 | 43% | 45% | 57% | 78% | 54% |
| 2002 | 41% | 50% | 62% | 84% | 58% |
| 2003 | 37% | 54% | 70% | 80% | 58% |
| 2004 | 39% | 40% | 55% | 79% | 51% |
| 2005 | 43% | 47% | 65% | 81% | 58% |
| 2006 | 40% | 43% | 61% | 77% | 56% |
| 2007 | 39% | 49% | 58% | 77% | 56% |
| 2008 | 36% | 44% | 57% | 77% | 52% |
| 2009 | 33% | 44% | 60% | 78% | 53% |
| 2010 | 36% | 41% | 63% | 79% | 54% |
| 2011 | 33% | 48% | 61% | 80% | 56% |
| 2012 | 31% | 42% | 62% | 78% | 54% |
| 2013 | 39% | 49% | 66% | 82% | 58% |
| 2014 | 34% | 49% | 67% | 79% | 57% |
| 2015 | 39% | 51% | 66% | 82% | 59% |
| 2016 | 41% | 58% | 70% | 88% | 63% |
| 2017 | 46% | 60% | 75% | 87% | 65% |
| 2018 | 43% | 59% | 69% | 85% | 63% |
| 2019 | 43% | 60% | 76% | 86% | 64% |
| 2020 | 47% | 57% | 70% | 82% | 63% |
| 2021 | 35% | 45% | 61% | 66% | 49% |
| 2022 | 37% | 49% | 62% | 72% | 54% |
| 2023 | 42% | 55% | 71% | 76% | - |
The chart is not accessible to screen readers. Please switch to the table view to access the data.
Loading statistic...
Download
Source
Sources
Release date
August 2024
More information
Region
France
Survey time period
1999 - 2023
Supplementary notes
Monthly standard of living for a single person, after social contributions and before taxes.
Citation formats