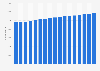
| Characteristic | Revenue (in billions of U.S. dollars) |
|---|---|
| - | - |
| - | - |
| - | - |
| - | - |
| - | - |
| - | - |
| - | - |
| - | - |
| - | - |
| - | - |
| - | - |
| - | - |
| - | - |
| - | - |
| - | - |
The chart is not accessible to screen readers. Please switch to the table view to access the data.
Download
Source
Source
Release date
February 2011
More information
Region
United States
Survey time period
2002 - 2010
Supplementary notes
* The coffee shop and snack industry includes establishments that sell specialty snacks and non-alcoholic beverages, which include ice cream, frozen yogurt, cookies, bagels, donuts, coffee, juices, smoothies, or sodas.
** The data from 2011 to 2016 are forecasts.
Citation formats