

| Characteristic | Share of respondents |
|---|---|
| - | - |
| - | - |
| - | - |
| - | - |
| - | - |
| - | - |
| - | - |
| - | - |
| - | - |
| - | - |
| - | - |
| - | - |
| - | - |
The chart is not accessible to screen readers. Please switch to the table view to access the data.
Download
Source
Source
Release date
June 2025
More information
Region
Denmark
Survey time period
April 2 to 21, 2025
Number of respondents
1,835 consumers**
Supplementary notes
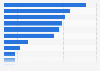
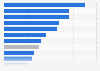
This question was phrased by the source as follows: "Thinking about when it comes to making a purchase of [category], what proportion of your spend is made online/digitally today (instead of buying products from physical stores)?"
*Including low and no-alcohol alternatives.
**approximately 300 respondents per category.
Citation formats