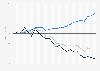
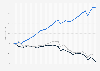
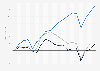
| Characteristic | GDP | Territorial CO鈧� emissions |
|---|---|---|
| - | - | - |
| - | - | - |
| - | - | - |
| - | - | - |
| - | - | - |
| - | - | - |
| - | - | - |
| - | - | - |
| - | - | - |
| - | - | - |
| - | - | - |
| - | - | - |
| - | - | - |
| - | - | - |
| - | - | - |
| - | - | - |
| - | - | - |
| - | - | - |
The chart is not accessible to screen readers. Please switch to the table view to access the data.
Worldwide
2005 to 2022
Gross Domestic Product (GDP) figures are adjusted for inflation.
*Annual total production-based emissions of carbon dioxide (CO鈧�), excluding land-use change, measured in metric tons. This is based on territorial emissions, which do not account for emissions embedded in traded goods.
GDP is the sum of gross value added by all resident producers in the country plus any product taxes and minus any subsidies not included in the value of the products. It is calculated without making deductions for depreciation of fabricated assets or for depletion and degradation of natural resources. Data are in constant 2017 international dollars.