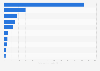
| Characteristic | Positive | Neither positive nor negative | Negative | Don't know |
|---|---|---|---|---|
| All | 31% | 43% | 20% | 6% |
| UAE | 48% | 32% | 17% | 4% |
| Indonesia | 47% | 34% | 16% | 3% |
| India | 41% | 37% | 18% | 4% |
| Mexico | 39% | 39% | 18% | 5% |
| Singapore | 32% | 47% | 18% | 3% |
| Poland | 32% | 44% | 13% | 12% |
| Hong Kong | 31% | 50% | 17% | 2% |
| Spain | 31% | 52% | 14% | 3% |
| Italy | 30% | 43% | 21% | 7% |
| Australia | 30% | 41% | 25% | 4% |
| France | 26% | 46% | 22% | 6% |
| Sweden | 24% | 46% | 20% | 10% |
| Great Britain | 24% | 46% | 26% | 4% |
| Canada | 24% | 49% | 21% | 6% |
| United States | 23% | 47% | 22% | 8% |
| Denmark | 23% | 47% | 20% | 10% |
| Germany | 19% | 43% | 30% | 9% |
The chart is not accessible to screen readers. Please switch to the table view to access the data.
Loading statistic...
Download
Source
Source
In cooperation with
YouGov
Release date
May 2024
More information
Region
Worldwide
Survey time period
January 2024
Age group
18 years and older
Method of interview
Online survey
Supplementary notes
Original question: Overall, do you have a positive or negative view of people who work in the following markets?
The sample size in each market consisted of between 500 and 2,040 respondents.
The data from most markets was nationally representative, the data from Hong Kong and Indonesia was online representative, and the data from Mexico and India was representative of urban populations.
Citation formats