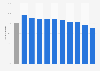
| Characteristic | 50th percentile (median)* | 90th percentile* |
|---|---|---|
| Canada | 4 | 28 |
| Prince Edward Island | 8 | 28 |
| Manitoba | 6 | 53 |
| Ontario | 4 | 27 |
| Alberta | 3 | 35 |
| Saskatchewan | 3 | 35 |
| British Columbia | 3 | 26 |
The chart is not accessible to screen readers. Please switch to the table view to access the data.
Canada
Fiscal year 2022-2023
The source adds the following information:
Canada is a weighted average of the jurisdictions shown.
Home care services are service visits to support clients living in the community. They could be home health services or home support services:
Home health services are those provided by home health care professionals (e.g., nurses, physiotherapists, occupational therapists, clinical nutritionists). Includes only face-to-face visits (i.e., in person, videoconference).
Home support services are provided to clients to enable them to live at home, specifically homemaking and personal care services. Includes only in-person visits. Excludes other home support services such as home maintenance/adaptation and respite care.
*50th percentile (Median): The number of days that half of clients waited for their first receipt of home care services and half were still waiting.
90th percentile: The number of days that 90% of clients waited for their first receipt of home care services and 10% were still waiting