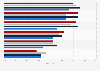
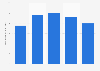
| Characteristic | Increased spending by more than 50% | Increased spending by less than 50% | Mostly unchanged | Reduced spending by less than 50% | Reduced spending by more than 50% |
|---|---|---|---|---|---|
| - | - | - | - | - | - |
| - | - | - | - | - | - |
| - | - | - | - | - | - |
| - | - | - | - | - | - |
| - | - | - | - | - | - |
| - | - | - | - | - | - |
The chart is not accessible to screen readers. Please switch to the table view to access the data.
Download
Source
Source
Release date
March 2023
More information
Region
China
Survey time period
November 2022
Number of respondents
2,000 respondents
Age group
18-73 years
Special properties
among residents in 301 of China's tier-1 to tier 5 cities/autonomous regions
Method of interview
Online survey
Supplementary notes
Original question: "Compared to a year ago, have your consumption habits changed in the following product categories in the past year?"
Citation formats