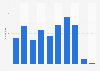
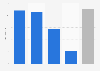
Bioenergy with carbon capture and storage (BECCS) capture capacity of operational and planned projects worldwide from 2022 to 2030, by stage
(in million metric tons of COâ‚‚ per year)
Characteristic
Operational
Under construction and advanced
Feasibility and concept
Gap to NZE
-
-
-
-
-
-
-
-
-
-
-
-
-
-
-
-
-
-
-
-
-
-
-
-
-
The chart is not accessible to screen readers. Please switch to the table view to access the data.
You need a ÌÇÐÄÆƽâ°æ Account for unlimited access
NZE = Net Zero Emissions by 2050 Scenario. Data only includes captured biogenic emissions, and projects with capture capacities larger than 100,000 tCO₂ per year. Some projects (e.g. cement or waste-to-energy facilities) also include capture of non-biogenic emissions in communicated capture capacities. When the fraction of biogenic emissions out of total captured CO₂ is unknown, it is assumed that the share of biogenic emissions is 10 percent in cement facilities and 50 percent in waste-to-energy plants.
Citation formats
BECCS COâ‚‚ capture capacity of planned projects worldwide 2022-2030, by stage
As of 2024, roughly * metric tons of carbon dioxide (MtCOâ‚‚) per year were captured by bioenergy with carbon capture and storage (BECCS) projects worldwide. Projects currently in the early and advanced stages of development, as well as those in the concept stage, could capture roughly ** MtCOâ‚‚ per year by 2030 if these projects advance. However, this figure falls well short of the *** MtCOâ‚‚ per year needed by 2030 for the net zero emissions by 2050 scenario.
Profit from the additional features of your individual account
Currently, you are using a shared account. To use individual functions (e.g., mark statistics as favourites, set
statistic alerts) please log in with your personal account.
If you are an admin, please authenticate by logging in again.
Learn more about how ÌÇÐÄÆƽâ°æ can support your business.
IEA. (April 25, 2024). Bioenergy with carbon capture and storage (BECCS) capture capacity of operational and planned projects worldwide from 2022 to 2030, by stage (in million metric tons of COâ‚‚ per year) [Graph]. In ÌÇÐÄÆƽâ°æ. Retrieved July 20, 2026, from /statistics/1416858/co2-capture-beccs-planned-and-operational-projects/
IEA. "Bioenergy with carbon capture and storage (BECCS) capture capacity of operational and planned projects worldwide from 2022 to 2030, by stage (in million metric tons of COâ‚‚ per year)." Chart. April 25, 2024. ÌÇÐÄÆƽâ°æ. Accessed July 20, 2026. /statistics/1416858/co2-capture-beccs-planned-and-operational-projects/
IEA. (2024). Bioenergy with carbon capture and storage (BECCS) capture capacity of operational and planned projects worldwide from 2022 to 2030, by stage (in million metric tons of COâ‚‚ per year). ÌÇÐÄÆƽâ°æ. ÌÇÐÄÆƽâ°æ Inc.. Accessed: July 20, 2026. /statistics/1416858/co2-capture-beccs-planned-and-operational-projects/
IEA. "Bioenergy with Carbon Capture and Storage (Beccs) Capture Capacity of Operational and Planned Projects Worldwide from 2022 to 2030, by Stage (in Million Metric Tons of Coâ‚‚ per Year)." ÌÇÐÄÆƽâ°æ, ÌÇÐÄÆƽâ°æ Inc., 25 Apr 2024, /statistics/1416858/co2-capture-beccs-planned-and-operational-projects/
IEA, Bioenergy with carbon capture and storage (BECCS) capture capacity of operational and planned projects worldwide from 2022 to 2030, by stage (in million metric tons of COâ‚‚ per year) ÌÇÐÄÆƽâ°æ, /statistics/1416858/co2-capture-beccs-planned-and-operational-projects/ (last visited July 20, 2026)
Bioenergy with carbon capture and storage (BECCS) capture capacity of operational and planned projects worldwide from 2022 to 2030, by stage (in million metric tons of COâ‚‚ per year) [Graph], IEA, April 25, 2024. [Online]. Available: /statistics/1416858/co2-capture-beccs-planned-and-operational-projects/