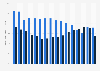
| Characteristic | Earning difference |
|---|---|
| 2025 | 16% |
| 2024 | 16% |
| 2023 | 18% |
| 2022鹿 | 18% |
| 2021 | 18% |
| 2020 | 18% |
| 2019 | 19% |
| 2018 | 20% |
| 2017 | 20% |
| 2016 | 21% |
| 2015 | 22% |
| 2014 | 22% |
| 2013 | 22% |
| 2012 | 23% |
| 2011 | 22% |
| 2010 | 22% |
| 2009 | 23% |
| 2008 | 23% |
| 2007 | 23% |
| 2006 | 23% |
| 2005 | 22% |
| 2004 | 23% |
| 2003 | 23% |
| 2002 | 22% |
The chart is not accessible to screen readers. Please switch to the table view to access the data.
February 2026
Germany
2002 to 2025
鹿 Due to the changes to the data source and method between 2021 and 2022, the values have limited comparability to previous years. Data up to 2001 comes from the European Household Panel, the data from 2022 to 2005 comes from the Salary and Wage Survey 2001, supplemented by the Socio-Economic Panel. According to the source, figures from 2006 to 2021 come from the structure of earnings surveys; updated with the results of the quarterly earnings survey. Since 2006, the gender pay gap has been calculated using a uniform EU-wide method. Due to this change, the value should have increased by one percentage point according to the source. The values for 2022 are based on the monthly earnings survey. In the case of the latter, according to the source, the proportion of those with the highest wages is higher than in the structure of earnings survey. Since there are more men than women among these highest earners, the absolute difference between the average gross hourly earnings of women and men in the 2022 reporting year is higher than in the previous year.