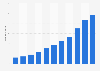
| Characteristic | Transaction value in trillion Japanese yen |
|---|---|
| - | - |
| - | - |
| - | - |
| - | - |
| - | - |
| - | - |
| - | - |
| - | - |
| - | - |
| - | - |
| - | - |
| - | - |
| - | - |
| - | - |
| - | - |
| - | - |
| - | - |
| - | - |
| - | - |
| - | - |
| - | - |
| - | - |
| - | - |
| - | - |
| - | - |
| - | - |
| - | - |
| - | - |
| - | - |
| - | - |
| - | - |
| - | - |
| - | - |
| - | - |
| - | - |
| - | - |
| - | - |
| - | - |
| - | - |
| - | - |
| - | - |
| - | - |
| - | - |
| - | - |
| - | - |
| - | - |
| - | - |
| - | - |
| - | - |
| - | - |
| - | - |
| - | - |
| - | - |
| - | - |
| - | - |
| - | - |
| - | - |
| - | - |
| - | - |
| - | - |
The chart is not accessible to screen readers. Please switch to the table view to access the data.
Download
Source
Source
Release date
February 2025
More information
Region
Japan
Survey time period
January 2020 to December 2024
Special properties
postal and online questionnaire; among businesses and establishments that operate in the credit card service industry
Supplementary notes
The survey respondents are companies with the highest sales value that cover about 70 percent of the yearly sales value of the industry in Japan.
Some figures have been changed since January 2020, January 2022 and January 2023, resulting in discontinuity with previous figures.
100 Japanese yen equal 0.64 U.S. dollars or 0.63 euros as of February 2025.
Values have been rounded.
Citation formats