| Characteristic | iOS apps | Android apps |
|---|---|---|
| - | - | - |
| - | - | - |
| - | - | - |
The chart is not accessible to screen readers. Please switch to the table view to access the data.
Download
Source
Source
Release date
April 2023
More information
Region
Worldwide
Survey time period
2022
Supplementary notes
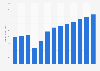
The source specifies that it analyzed 1,000 iOS and Android apps, each with at least 5,000 active users. across different categories, including travel, tourism & hospitality apps.
Citation formats