| Characteristic | Index score |
|---|---|
| - | - |
| - | - |
| - | - |
| - | - |
| - | - |
| - | - |
| - | - |
| - | - |
| - | - |
| - | - |
| - | - |
| - | - |
| - | - |
| - | - |
| - | - |
| - | - |
| - | - |
| - | - |
| - | - |
| - | - |
| - | - |
| - | - |
| - | - |
| - | - |
The chart is not accessible to screen readers. Please switch to the table view to access the data.
Download
Source
Source
In cooperation with
carVertical
Release date
October 2024
More information
Region
Europe
Survey time period
October 2023 to September 2024
Supplementary notes
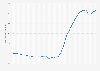
The used vehicle transparency index ranks countries based on six criteria for a total score of 1.2:
- Percentage of odometers clocked (0.3)
- Average odometer rollback value (0.15)
- Percentage of damaged cars (0.2)
- Relative damage value (0.2)
- Percentage of imported used cars (0.3)
- Average age of checked cars (0.05)
The data is based on customer car reports recorded over a 12 month period.
Citation formats