| Characteristic | Heat wave index |
|---|---|
| 2020 | 0.13 |
| 2019 | 0.06 |
| 2018 | 0.12 |
| 2017 | 0.09 |
| 2016 | 0.07 |
| 2015 | 0.11 |
| 2014 | 0.03 |
| 2013 | 0.09 |
| 2012 | 0.26 |
| 2011 | 0.3 |
| 2010 | 0.15 |
| 2009 | 0.07 |
| 2008 | 0.03 |
| 2007 | 0.17 |
| 2006 | 0.21 |
| 2005 | 0.05 |
| 2004 | 0.01 |
| 2003 | 0.12 |
| 2002 | 0.11 |
| 2001 | 0.1 |
| 2000 | 0.09 |
| 1999 | 0.1 |
| 1998 | 0.14 |
| 1997 | 0.01 |
| 1996 | 0.02 |
| 1995 | 0.09 |
| 1994 | 0.08 |
| 1993 | 0.04 |
| 1992 | 0.03 |
| 1991 | 0.04 |
| 1990 | 0.07 |
| 1989 | 0.04 |
| 1988 | 0.32 |
| 1987 | 0.05 |
| 1986 | 0.08 |
| 1985 | 0.03 |
| 1984 | 0.01 |
| 1983 | 0.14 |
| 1982 | 0.01 |
| 1981 | 0.07 |
| 1980 | 0.26 |
| 1979 | 0.02 |
| 1978 | 0.03 |
| 1977 | 0.09 |
| 1976 | 0.05 |
| 1975 | 0.06 |
| 1974 | 0.02 |
| 1973 | 0.02 |
| 1972 | 0.03 |
| 1971 | 0.04 |
| 1970 | 0.02 |
| 1969 | 0.03 |
| 1968 | 0.02 |
| 1967 | 0 |
| 1966 | 0.04 |
| 1965 | 0.01 |
| 1964 | 0.04 |
| 1963 | 0.03 |
| 1962 | 0.03 |
| 1961 | 0.04 |
| 1960 | 0.04 |
| 1959 | 0.02 |
| 1958 | 0.02 |
| 1957 | 0.01 |
| 1956 | 0.03 |
| 1955 | 0.14 |
| 1954 | 0.29 |
| 1953 | 0.08 |
| 1952 | 0.19 |
| 1951 | 0.06 |
| 1950 | 0.02 |
| 1949 | 0.07 |
| 1948 | 0.09 |
| 1947 | 0.15 |
| 1946 | 0.01 |
| 1945 | 0.01 |
| 1944 | 0.07 |
| 1943 | 0.07 |
| 1942 | 0.08 |
| 1941 | 0.18 |
| 1940 | 0.22 |
| 1939 | 0.09 |
| 1938 | 0.04 |
| 1937 | 0.07 |
| 1936 | 1.28 |
| 1935 | 0.17 |
| 1934 | 0.87 |
| 1933 | 0.22 |
| 1932 | 0.12 |
| 1931 | 0.56 |
| 1930 | 0.53 |
| 1929 | 0.02 |
| 1928 | 0.06 |
| 1927 | 0.01 |
| 1926 | 0.06 |
| 1925 | 0.16 |
| 1924 | 0.04 |
| 1923 | 0.03 |
| 1922 | 0.02 |
| 1921 | 0.12 |
| 1920 | 0.01 |
| 1919 | 0.03 |
| 1918 | 0.23 |
| 1917 | 0.17 |
| 1916 | 0.13 |
| 1915 | 0.04 |
| 1914 | 0.1 |
| 1913 | 0.09 |
| 1912 | 0.04 |
| 1911 | 0.2 |
| 1910 | 0.07 |
| 1909 | 0.05 |
| 1908 | 0.04 |
| 1907 | 0.02 |
| 1906 | 0.04 |
| 1905 | 0.05 |
| 1904 | 0.01 |
| 1903 | 0.01 |
| 1902 | 0.06 |
| 1901 | 0.32 |
| 1900 | 0.12 |
| 1899 | 0.05 |
| 1898 | 0.06 |
| 1897 | 0.16 |
| 1896 | 0.09 |
| 1895 | 0.03 |
The chart is not accessible to screen readers. Please switch to the table view to access the data.
Zoomable Statistic: Select the range in the chart you want to zoom in on.
Loading statistic...
Download
Source
More information
Region
United States
Survey time period
1895 to 2020
Supplementary notes
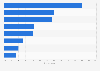
The U.S. Annual Heat Wave Index tracks the occurrence of heat wave conditions across the contiguous 48 states from 1895 to 2020. This index defines a heat wave as a period lasting at least four days with an average temperature that would only be expected to occur once every 10 years, based on the historical record. The index value for a given year depends on how often such severe heat waves occur and how widespread they are.
Citation formats