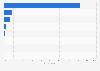
| Characteristic | Number of paid users in thousands |
|---|---|
| Q3 '25 | 14,500 |
| Q2 '25 | 14,100 |
| Q1 '25 | 14,200 |
| Q4 '24 | 14,607 |
| Q3 '24 | 15,214 |
| Q2 '24 | 14,841 |
| Q1 '24 | 14,930 |
| Q4 '23 | 15,186 |
| Q3 '23 | 15,712 |
| Q2 '23 | 15,630 |
| Q1 '23 | 15,874 |
| Q4 '22 | 16,065 |
| Q3 '22 | 16,548 |
| Q2 '22 | 16,395 |
| Q1 '22 | 16,334 |
| Q4 '21 | 16,249 |
| Q3 '21 | 16,303 |
| Q2 '21 | 14,969 |
| Q1 '21 | 14,417 |
| Q4 '20 | 14,161 |
| Q3 '20 | 14,026 |
| Q2 '20 | 13,005 |
The chart is not accessible to screen readers. Please switch to the table view to access the data.
November 2025
Worldwide
Q2 2020 to Q3 2025
total payers, including those who made only 脿 la carte purchases.
No data available for missing quarters.
From the second quarter 2021, Match Group reports "payers" instead of "subscribers": "rather than presenting Average Subscribers and Average Revenue per Subscriber (鈥淎RPU鈥�), we now present Payers and Revenue Per Payer (鈥淩PP鈥�) (as defined below). Unlike Average Subscribers, which included only users who purchased a subscription and were counted on a daily basis, Payers include all users from whom we earn revenue (including those who make only 脿 la carte purchases) and are counted as unique users in a given month. Similarly, ARPU was a daily metric and included direct revenue sourced from subscribers only, whereas RPP is a monthly metric and includes all direct revenue. We believe that Payers and RPP, which account for non-subscriber users and the associated revenue, are more useful in evaluating the performance of our business."