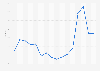
| Characteristic | Saving ratio |
|---|---|
| - | - |
| - | - |
| - | - |
| - | - |
| - | - |
| - | - |
| - | - |
| - | - |
| - | - |
| - | - |
| - | - |
| - | - |
| - | - |
| - | - |
| - | - |
| - | - |
| - | - |
| - | - |
| - | - |
| - | - |
| - | - |
| - | - |
| - | - |
| - | - |
| - | - |
| - | - |
| - | - |
| - | - |
| - | - |
| - | - |
| - | - |
| - | - |
| - | - |
| - | - |
| - | - |
| - | - |
| - | - |
| - | - |
| - | - |
| - | - |
| - | - |
The chart is not accessible to screen readers. Please switch to the table view to access the data.
Download
Source
Source
Release date
July 2025
More information
Region
Japan
Survey time period
Q1 2015 to Q1 2025
Special properties
seasonally adjusted figures; based on preliminary figures
Supplementary notes
Estimated based on second preliminary estimates of GDP for January to March 2025.
Including private unincorporated enterprises.
Saving ratio = net saving / (disposable income + adjustment for the change in pension entitlements, receivable)
Citation formats