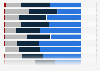
| Characteristic | Urban | Rural |
|---|---|---|
| Piped water into dwelling | 8.2% | 1% |
| Piped water into yard, plot or compound | 6.8% | 1.8% |
| Public tap or standpipe | 10.4% | 4.9% |
| Tube well or borehole | 44.7% | 41.6% |
| Protected dug well | 15% | 13.7% |
| Unprotected dug well | 2.1% | 11.3% |
| Protected spring | 0.2% | 1.2% |
| Unprotected spring | 0.5% | 3.5% |
| Rainwater collection | - | 0.1% |
| Bottled water | 0.2% | - |
| Purchased from a cart with a small tank or drum | 8.1% | 4% |
| Purchased from a tanker truck | 1.2% | 1.4% |
| Surface water, like a river, dam, lake, pond, stream, canal or irrigation channel | 2.1% | 14.9% |
| Other | 0.4% | 0.6% |
The chart is not accessible to screen readers. Please switch to the table view to access the data.
Loading statistic...
Download
Source
More information
Region
Nigeria
Survey time period
January 20 to February 3, 2020
Number of respondents
1,599 respondents
Age group
18 years and older
Supplementary notes
Nationally representative, random, clustered, stratified, multi-stage area probability sample.
Citation formats