
| Characteristic | Average response rate |
|---|---|
| - | - |
| - | - |
| - | - |
| - | - |
| - | - |
| - | - |
| - | - |
| - | - |
| - | - |
| - | - |
| - | - |
| - | - |
| - | - |
| - | - |
| - | - |
| - | - |
| - | - |
| - | - |
| - | - |
| - | - |
| - | - |
| - | - |
| - | - |
| - | - |
| - | - |
The chart is not accessible to screen readers. Please switch to the table view to access the data.
Download
Source
Source
Release date
March 2021
More information
Region
Worldwide
Survey time period
January to December, 2020
Special properties
iOS and Android
Supplementary notes
According to the source: "The data in this report is from 1,000 iOS and Android apps with 5,000+ active users [...] Data was gathered from over a billion app installs. All apps included in the data are Apptentive customers. All data for Android apps are
global. Ratings data for iOS apps are US-only"
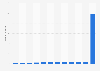
The source defines the average response rate to in-app interactions as the rate of consumers "who were interacted with and responded to the brand's outreach."
Citation formats