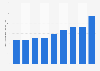


| Characteristic | Total session trend | Day 30 retention rate (average per app) |
|---|---|---|
| - | - | - |
| - | - | - |
| - | - | - |
| - | - | - |
| - | - | - |
| - | - | - |
| - | - | - |
| - | - | - |
| - | - | - |
| - | - | - |
| - | - | - |
| - | - | - |
| - | - | - |
| - | - | - |
| - | - | - |
The chart is not accessible to screen readers. Please switch to the table view to access the data.
Download
Source
Source
Release date
November 2020
More information
Region
Worldwide
Survey time period
July 2019 to September 2020
Supplementary notes
According to the source: "The trend displaying total sessions [...] was created by comparing the number of sessions [...] among the top 5,000 apps in each analyzed month; each metric, including the day 30 rate was then normalized to enable an apples to apples comparison."
A session is as "the amount of time in which a user is actively engaged with either an app in the foreground or with an open website. [...] In the mobile ecosystem, a session begins when the app is opened in the foreground, and ends when it goes into the background with no events occurring during a predetermined time window [...]"
Citation formats



