| Characteristic | Expected | Actual |
|---|---|---|
| - | - | - |
| - | - | - |
| - | - | - |
| - | - | - |
| - | - | - |
| - | - | - |
The chart is not accessible to screen readers. Please switch to the table view to access the data.
Download
Source
Sources
Release date
April 2020
More information
Region
Australia
Survey time period
2020
Number of respondents
90 respondents
Special properties
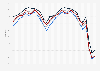
survey among 90 hotel operators, accounting for 15,160 hotel rooms
Supplementary notes
*Forecasted
Expected values denote the occupancy rates budgeted for in the respective period.
Citation formats