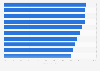
| Characteristic | N100 | G250 |
|---|---|---|
| 2020 | 80% | 96% |
| 2017 | 75% | 93% |
| 2015 | 73% | 92% |
| 2013 | 71% | 93% |
| 2011 | 64% | 95% |
| 2008 | 53% | 83% |
| 2005 | 41% | 64% |
| 2002 | 18% | 45% |
| 1999 | 24% | 35% |
| 1996 | 18% | - |
| 1993 | 12% | - |
The chart is not accessible to screen readers. Please switch to the table view to access the data.
Loading statistic...
Download
Source
Source
Release date
November 2020
More information
Region
Worldwide
Survey time period
1993 to 2020
Special properties
among the largest companies by revenue
Supplementary notes
The survey findings are based on analysis of publicly available information reported by respective companies.
N100 companies include the top 100 companies based on their revenue in about 52 countries (n=5,200).
G250 companies comprise of the top 250 companies from the Fortune Global 500 ranking for 2019 (n=250). It is to be noted that except 23 companies (those that did not have headquarters in the countries not covered in N100 list), the rest have also been covered in N100.
Citation formats