

| Characteristic | February 2020 (pre-pandemic) | June 2020 (post-pandemic) |
|---|---|---|
| - | - | - |
| - | - | - |
| - | - | - |
| - | - | - |
| - | - | - |
| - | - | - |
| - | - | - |
| - | - | - |
| - | - | - |
| - | - | - |
| - | - | - |
| - | - | - |
The chart is not accessible to screen readers. Please switch to the table view to access the data.
Download
Source
Source
Release date
August 2020
More information
Region
Worldwide
Survey time period
February 2020 to June 2020
Supplementary notes
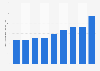
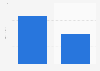
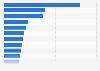
According to the source: "Data includes 744,469,537 individual app users, of which 52% were Android and 48% were iOS. Subregions and industry verticals included were those with 10 million or more users in February 2020. Countries included were those with 1 million or more users in February 2020."
Citation formats





