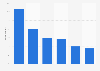
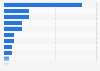
| Characteristic | Share of respondents |
|---|---|
| - | - |
| - | - |
| - | - |
| - | - |
The chart is not accessible to screen readers. Please switch to the table view to access the data.
Download
Source
Source
Release date
January 2021
More information
Region
Worldwide
Survey time period
May 2020
Number of respondents
1,620*
Special properties
among B2B marketers
Supplementary notes
*Survey respondent origins: 65% from the U.S., 30% from Europe and 5% from rest of the world.
Question: "How much do you spend per virtual event participant?"
Citation formats