| Characteristic | Share of respondents |
|---|---|
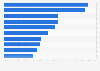
| Singapore | 92% |
| United States | 92% |
| Poland | 91% |
| South Korea | 89% |
| India | 88% |
| South Africa | 87% |
| Malaysia | 86% |
| Mexico | 85% |
| Sweden | 85% |
| Australia | 84% |
| Peru | 84% |
| Hungary | 83% |
| Great Britain | 83% |
| Global average | 82% |
| Argentina | 82% |
| Brazil | 81% |
| Spain | 81% |
| Turkey | 80% |
| Saudi Arabia | 80% |
| Belgium | 79% |
| Chile | 79% |
| Italy | 78% |
| Netherlands | 77% |
| France | 77% |
| Germany | 77% |
| China | 77% |
| Canada | 73% |
| Japan | 72% |
| Russia | 65% |
The chart is not accessible to screen readers. Please switch to the table view to access the data.
March 2021
Worldwide
December 23, 2020 to January 8, 2021
20,000*
16-74 years
Respondents answering very often/ fairly often/sometimes
Online survey
The source adds the following information:
"The sample consists of approximately 1,000 individuals in each of Australia, Belgium, Brazil, Canada, mainland
China, France, Germany, Great Britain, Italy, Japan, Spain and the U.S., and 500 individuals in each of Argentina, Chile, Hungary, India, Malaysia, Mexico, the
Netherlands, Peru, Poland, Russia, Saudi Arabia, Singapore, South Africa, South Korea, Sweden, and Turkey."
and
"The samples in Brazil, Chile, mainland China, India, Israel, Malaysia, Mexico, Peru, Russia, Saudi Arabia, Singapore, South Africa, and Turkey are more urban,
more educated, and/or more affluent than the general population. The survey results for these markets should be viewed as reflecting the views of the more
鈥渃onnected鈥� segment of their population."
*All parents: 7,273