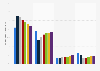
| Characteristic | Annual growth rate |
|---|---|
| - | - |
| - | - |
| - | - |
| - | - |
| - | - |
| - | - |
| - | - |
| - | - |
| - | - |
| - | - |
| - | - |
| - | - |
| - | - |
| - | - |
| - | - |
| - | - |
| - | - |
| - | - |
| - | - |
| - | - |
| - | - |
| - | - |
| - | - |
| - | - |
| - | - |
| - | - |
| - | - |
| - | - |
| - | - |
| - | - |
| - | - |
| - | - |
| - | - |
| - | - |
The chart is not accessible to screen readers. Please switch to the table view to access the data.
Download
Source
Source
Release date
September 2020
More information
Region
Japan
Survey time period
January to August 2020
Supplementary notes
The year-on-year growth refers to the share of bookings compared to the same week in the last year. The dates refer to the week ending (e.g. January 12, 2020 shows the YOY change in number of bookings between January 6 to 12, 2020).
Data is based on the review data scraped by Airbtics from Airbnb.com between September 7 to 22, 2020. Limitation: 80-95% of active listings.
"Active listing" here means a listing that has its first review before 2019 April and its last review after 2020 March, so that the booking difference between 2019 and 2020 can be compared in a more fair way.
Citation formats