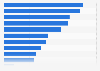
| Characteristic | Online travel agencies | Traditional travel agents |
|---|---|---|
| - | - | - |
| - | - | - |
| - | - | - |
| - | - | - |
| - | - | - |
| - | - | - |
| - | - | - |
| - | - | - |
| - | - | - |
| - | - | - |
The chart is not accessible to screen readers. Please switch to the table view to access the data.
April 2020
United Kingdom
January and March 20-23, 2020**
1500**
UK adults; nationally representatitive sample according to age, gender, region and social grade
Online interview
* Respndents were asked for their reasons for booking through online travel agencies instead of going directly to the provider. Answers for traditional travel agent were included as a benchmark.
** The report used a nationally representative sample of 1000 UK adults, interviewed online in the first two weeks of January. Additionally 500 respondents were interviewed in March 20-23, 2020. The source does not provide information on whether the data shown in this statistic used data from the January or March sample.