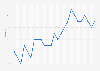
| Characteristic | Unemployment rate* |
|---|---|
| Mar '24 | 7.3% |
| Feb '24 | 7.2% |
| Jan '24 | 6.4% |
| Dec '23 | 6.6% |
| Nov '23 | 6.6% |
| Oct '23 | 6.7% |
| Sep '23 | 6.6% |
| Aug '23 | 6.3% |
| Jul '23 | 6.6% |
| Jun '23 | 6.8% |
| May '23 | 7.1% |
| Apr '23 | 7.5% |
| Mar '23 | 7.3% |
| Feb '23 | 8% |
| Jan '23 | 7.1% |
| Dec '22 | 7.6% |
| Nov '22 | 7.2% |
| Oct '22 | 7.7% |
| Sep '22 | 7.3% |
| Aug '22 | 6.8% |
| Jul '22 | 6.8% |
| Jun '22 | 7.2% |
| May '22 | 8.3% |
| Apr '22 | 9.4% |
| Mar '22 | 14.5% |
| Feb '22 | 8.6% |
| Jan '22 | 7.8% |
| Dec '21 | 9.1% |
| Nov '21 | 9.6% |
| Oct '21 | 10% |
| Sep '21 | 9.5% |
| Aug '21 | 9.4% |
| Jul '21 | 10.3% |
| Jun '21 | 12% |
| May '21 | 15.1% |
| Apr '21 | 15.3% |
| Feb '21 | 14.5% |
| Jan '21 | 13% |
| Nov '20 | 15.1% |
| Oct '20 | 16.4% |
| Sep '20 | 16.5% |
| Aug '20 | 15.6% |
| Jul '20 | 16.4% |
| Jun '20 | 16.3% |
| May '20 | 13.1% |
| Apr '20 | 9% |
| Mar '20 | 7.8% |
| Feb '20 | 7.1% |
| Jan '20 | 6.3% |
| Dec '19 | 6.1% |
| Nov '19 | 6.3% |
| Oct '19 | 6.4% |
| Sep '19 | 5.8% |
| Aug '19 | 5.8% |
| Jul '19 | 6% |
| Jun '19 | 6.3% |
| May '19 | 6.7% |
| Apr '19 | 7.3% |
| Mar '19 | 8.2% |
| Feb '19 | 7.6% |
| Jan '19 | 6.5% |
The chart is not accessible to screen readers. Please switch to the table view to access the data.
Loading statistic...
Download
Source
Source
Release date
June 2024
More information
Region
Peru
Survey time period
January 2019 to March 2024
Number of respondents
4,800 households**
Supplementary notes
* Figures represent three-month average unemployment rates, calculated between the indicated month and the two preceding consecutive months.
** In the provinces of Lima and Callao.
Citation formats