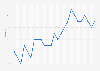
| Characteristic | Unemployment rate |
|---|---|
| 2022 | 5.4% |
| 2021 | 5.4% |
| 2020 | 6.5% |
| 2019 | 5.3% |
| 2018 | 4.1% |
| 2017 | 4.2% |
| 2016 | 4.5% |
| 2015 | 5.4% |
| 2014 | 6.8% |
| 2013 | 6.9% |
| 2012 | 7.3% |
| 2011 | 6.3% |
| 2010 | 6.8% |
| 2009 | 7% |
| 2008 | 4.6% |
| 2007 | 6.2% |
| 2006 | 4% |
| 2005 | 3.1% |
The chart is not accessible to screen readers. Please switch to the table view to access the data.
Loading statistic...
Download
Source
Source
Release date
August 2024
More information
Region
Mexico
Survey time period
2005 to 2022
Age group
15-64 years
Supplementary notes
The source adds: The foreign-born unemployment rate is calculated as the share of unemployed foreign-born persons aged 15-64 in the foreign-born labour force (the sum of employed and unemployed foreign-born) of that same age. Unemployed people consist of those persons who report that they are without work during the reference week, are available for work and have taken active steps to find work during the four weeks preceding the interview This indicator is measured as a percentage of foreign-born labour force.
Citation formats