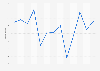
| Characteristic | Ipsos economic index |
|---|---|
| - | - |
| - | - |
| - | - |
| - | - |
| - | - |
| - | - |
| - | - |
| - | - |
| - | - |
| - | - |
| - | - |
| - | - |
| - | - |
| - | - |
| - | - |
| - | - |
| - | - |
| - | - |
| - | - |
| - | - |
| - | - |
The chart is not accessible to screen readers. Please switch to the table view to access the data.
December 2020
APAC
April 2019 to December 2020
approx. 500 adults (see source for information)
16 to 74 years
Online panel
The Index is normalized to a 0 to 100-point range with 鈥�50鈥� representing the historical median. Index values are calculated by utilizing data from individual survey question results.
The index reflects respondent perceptions regarding the current local economy, future local economy, current financial situation, future financial situation, major purchase comfort, household purchase comfort, job security, investment confidence, job loss experience, and job loss expectations within their country.
Source did not provide a release date, date displayed was the date of access.